Horizontal and vertical analysis of the accounting documents and reports of the enterprise is an effective tool for researching the state of the enterprise and the effectiveness of its activities. Recommendations made on the basis of this analysis are constructive and can significantly improve the state of the enterprise, if they can be implemented.
Horizontal analysis
Usually, the horizontal analysis of accounting statements is done first. It assumes that the company has been operating for several periods because this analysis focuses on trends and changes in financial statements over time. Along with the amounts presented in financial reports, horizontal analysis can help the user of accounting reports to see relative changes over time and identify positive or possibly disturbing trends.
Income statement
Let’s review an example Profit and loss statement to understand how horizontal analysis can be applied to this report.
In our example, the year of 2014 serves as a base year and each line item in the financial statements in subsequent years is converted from the dollar amount into a percentage of the base year amount for the same line. Accordingly, revenues for 2015 and 2016 were 108% and 120% of the base year.
Do positive changes in the calculations above mean the company is doing great? Competitors in the same industry may be showing even greater growth. To make right conclusions, the user will need additional information – management plans or forecasts, industry averages, and/or numbers of another business that the user also considers investing in.
How to choose a base year? Basically, the choice depends on the particular user of the financial documents. For example, when investing in company stocks at a time when improvements or other changes occurred in the business, the year before these changes took place may serve as the base year.
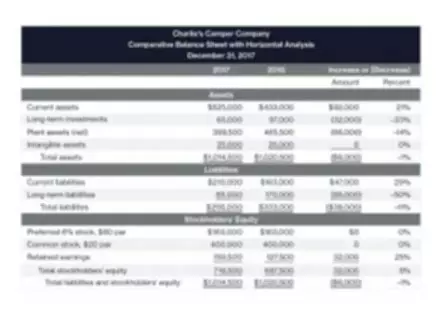
Balance sheet
The horizontal analysis involves a comparison of certain or all items of the Balance sheet at the reporting date with similar indicators for previous periods. This allows analyzing the change in individual indicators in dynamics over several years. For example, how much the organization’s Accounts receivable increased or Retained earnings decreased at the end of the current year compared to the previous year. The results of such an analysis contribute to making management decisions.
Vertical analysis
In order to determine the overall financial condition of the company a vertical analysis of its reports is a good step to take since all number for a given period are converted into a percentage of the main item of financial statements. This type of analysis enables the user to examine the composition of each accounting statement and determine whether there were any noteworthy changes.
Income statement
A quick analysis of the Income statement we reviewed earlier shows that the organization is quite stable. Such analysis of financial statements will be more meaningful if you compare the indicators with the average indicators of competitors or the industry as a whole, as well as indicators over a long period of time for one company. If there are some unreasonable fluctuations for one business over time and/or the percentages differ significantly from the industry average, a potential for misstatements in the financial statements should be considered.
Balance sheet
The vertical analysis consists of comparing individual Balance sheet items’ percentage of a base figure with other items. For example, you can analyze what proportion of current assets are inventories, receivables, or cash or how much the organization’s receivables exceed its liabilities, which is necessary, for example, when examining liquidity.
Vertical analysis, by definition, is carried out within a single reporting period. However, having calculated the percentage of indicators, the company often resort to horizontal analysis, tracing the change in these indicators over a number of periods.
For example, the vertical analysis showed that the share of fixed assets as of December 31, 2019 was equal 38% of the total assets of the organization; as of 31.12.2020 – 44%. In turn, horizontal analysis shows that over the year the share of fixed assets increased by 6%, i.e. production has become more capital intensive. Thus, although there is a significant difference between horizontal and vertical analysis, they complement each other and can be used simultaneously when compiling analytical tables.