The company’s ability to maintain its solvency and financial stability testifies to its stable financial condition. In turn, the financial analysis of the enterprise gives an understanding of whether, for example, the business is capable of successfully functioning and developing, maintaining the balance of its assets, and what kind of profit it can receive. Besides various ratios, one of the tools used to analyze the organization’s financial statements is vertical analysis.
Definition
It is possible to obtain information on changes in the structure of funds and their sources, as well as on their dynamics using horizontal and vertical analysis (each method has its own advantages). The vertical analysis allows studying the ratio of the selected indicator with other homogeneous indicators within one reporting period.
It makes it possible to draw a conclusion about the structure of the Balance sheet or any other financial report, as well as evaluate the dynamics of this structure. The methodology of vertical analysis consists in the fact that a base for analysis is selected and set as 100%, each article in the financial statement is then calculated as a percentage of the chosen baseline value.
Application
When analyzing the Profit and loss statement using this analysis method you would need to divide each line item by total revenue. If the company has multiple sources of revenue, it is also helpful to express revenue categories as a percentage relative to total revenue.

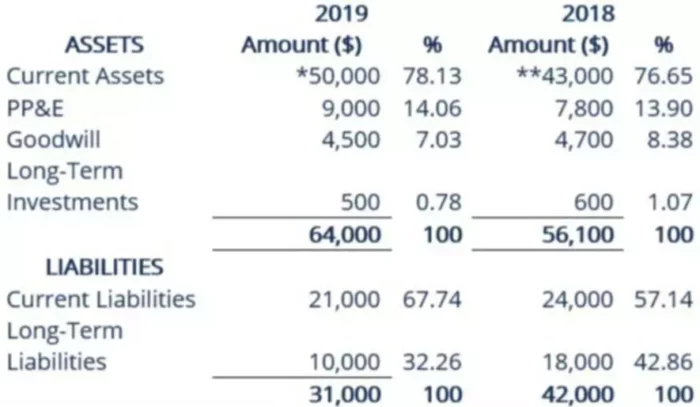
The analysis of the Balance sheet is prepared by dividing each Balance sheet asset item by the total assets and each liability and stockholder’s equity item by the total for each respective section. Thus, Balance sheet items are calculated as percentages, which emphasizes the composition of the Balance sheet.
For the Cash flow statement, there are two alternative approaches to the vertical analysis of this document. The first approach is to express each item of cash inflows (outflows) as a percentage of total cash inflows (outflows), and the second approach is to express each item as a percentage of net income.
Example
For example, we can see that the company’s accounts receivable increased from 35% to 57% of total assets. What are the possible reasons for this growth? An increase in receivables may be due to the fact that the company is selling more on credit rather than on a cash basis, possibly in response to some action taken by a competitor.
The other reason it may occur is due to changes in another category of current assets, for example, due to a decrease in the level of inventories. In this respect, the analyst will need to find out why this asset category has changed. Another possible reason for the increase in receivables in relation to assets may be related to the fact that the company changed its policy, relaxed its collection procedures, or adopted a more aggressive revenue recognition policy. The analyst may look at other metrics (such as comparing the growth rate of accounts receivable to the growth rate of sales) to get the most likely explanation for the change.