Many of us have heard about the concept of “liquidity” and might even have some idea what it means. Liquidity is the ability to pay obligations in full and on time. The most common indicators are Net Working Capital (NWC) and current ratio (CR). Today, the current liquidity ratio is one of the main ratios that can be used to assess the financial solvency of a legal entity.
The current ratio is one of the solvency or liquidity indicators reflecting the company’s ability to repay current (short-term) liabilities using only current assets. This indicator is calculated as the ratio of current assets (medium and highly liquid assets) to current liabilities.
The main difference between current assets and non-current assets is that the former can be converted into cash during one production cycle (most often it is a year). The current liquidity indicator reflects the company’s ability to meet current liabilities at the expense of current assets. The indicator shows how many dollars of working capital the company has for each dollar of current liabilities.
Purpose of the current ratio calculation
Before we dive into the explanation of the current ratio any deeper and figure out how to calculate it, we are going to first answer the question: “Why calculate the current ratio?”. This indicator is necessary to analyze the solvency of a legal entity. Besides the company’s management, the liquidity indicator is also of interest to investors, suppliers of raw materials, banks, shareholders, even ordinary employees.
The current liquidity ratio allows you to determine whether the sale of current assets can pay off current short-term liabilities. That is, for settlements with creditors, cash, its equivalents, and short-term financial investments will be used, accounts receivable will be collected, other current assets will be sold. All non-current assets will remain intact, thanks to which the business can pick up its activities and still be successful.
We can also say that the essence of calculating the current liquidity ratio is based on the fact that the company fulfills short-term obligations in most cases at the expense of its current assets. If these assets have exceeded the existing agreements, the company can be considered successfully existing.
Standard value
The current liquidity ratio of a business with a high paying capacity must be equal to 1 or higher, namely, current assets must exceed short-term liabilities. At the same time, it is also undesirable to have a number significantly higher than 1. This will be an indicator of slowed asset turnover. This may be due to a slowdown in the turnover of funds invested in inventories, an unjustified increase in accounts receivable, and so on.
Solvency problems are indicated by the value of the current ratio below the standard. This suggests that the company does not have enough assets to meet its obligations in a short perspective. This ultimately leads to a decrease in confidence in the company on the part of creditors, suppliers, investors, and partners. Also, problems with solvency can lead to an increase in the cost of borrowed funds and, as a result, to direct financial losses.
With an optimal ratio of assets and liabilities, the ratio is equal to 2–2.5. That is, the company owes to third-party entities or employees half the amount of funds that it has in circulation. With a sudden market fluctuation, the liquidation of assets will not cause major problems. It should be noted, though, that an indicator that is less than one can possibly be a form of the norm for enterprises with a high capital turnover rate, which contributes to a frequent change of the values involved.
Analysing the data
The analysis of the current liquidity ratio can be carried out in three directions.
- The first is the calculation of the ratio as of the reporting date and comparison with the standard.
- The second is a comparison with the industry over the same period of time. If the ratio for your company is both below the standards and below the average, then your business may be declared insolvent. This can lead to bankruptcy.
- The third direction of analysis is the study of the dynamics of changes in the current ratio. In such an analysis, it can be useful not only to calculate the difference between the past and the present but to determine the reasons for such changes. For this, factor analysis is used.
Easy formula for calculation
What documents should be prepared when you are planning to calculate the current ratio? If this indicator is determined when the financial reports are already prepared, only a Balance sheet is needed. However, if you need to calculate it at some other date and only have bookkeeping records, you will have to collect all the papers where inventory, cash, income (receivables), prepaid expenses, and debt obligations appear. Then, you would look for everything that relates to the current accounting period and organize it into two categories: assets and obligations.
Next, you would simply use the formula presented below, enter appropriate values, and do some simple math.
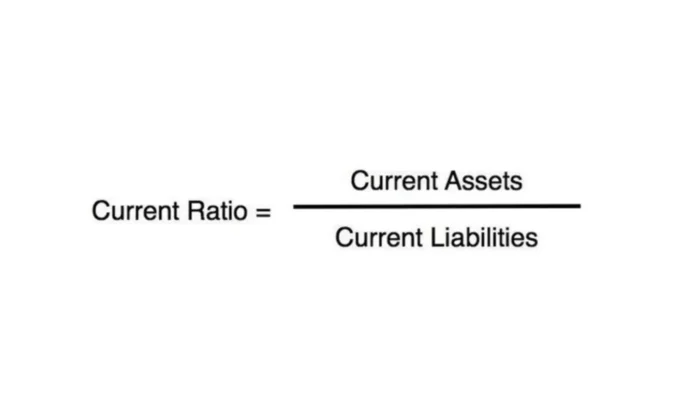
Let’s try to see how this works using data from a sample Balance sheet. The Wood Works LLC has the following items on its financial report.
Assets:
- Cash on hand $10,000
- Bank $15,000
- Prepaid expenses $1,500
- Revenue receivable $17,500
- Inventory $15,000
- Fixed assets $95,000
Liabilities:
- Taxes payable $8,000
- Outstanding expenses $12,800
- Interest payable $2,000
- Loans $19,500
The first value we would need is all our current assets, so let’s add them up. We would add all the assets provided in the list except for one. The fixed assets amount is not going to be included. So, our total comes out to be $59,000. The same goes for the liabilities, but in this case, we are going to skip loans because these will not be paid any time soon. After doing a little math, we got $22,800 for the liabilities. Now, all we have to do is divide $59,000 by $22,800. What do we get?
We have a ratio of 2.59. It looks like Wood Works LLC is doing great based on this particular financial indicator. It is likely that the creditors will be willing to provide more loans to this company and investors might look into this company as a potential investment object.
If this ratio, though, was slightly higher, we would need to evaluate its reports a bit deeper and see if the company is using the assets it has effectively instead of letting the money sit around without bringing many benefits to the interested parties. A comparison of this value with standards in the industry and values for previous accounting periods will definitely give us a better picture of what is truly happening inside this business and whether the management and shareholders are making the right decisions.