Sometimes, it is not enough to say a business is in “good health” or “bad health”. Thus, the management and investors often turn to financial ratios to put a number on this health, properly evaluate it and make the right decisions.
Definition
The working capital ratio consists of the difference between the total current assets and the total current liabilities. It indicates the company’s ability to meet its financial obligations in the upcoming short period and fund its business operations with its current cash-on-hand and liquid assets. This ratio is an important gauge of financial solvency and liquidity of the business.
It is also tied to a specific time frame. In most cases, it is measured over a period of a year. It can also be measured using the period of one business cycle, whatever that means for the business.
Formula
To find the working capital ratio, you are going to subtract current liabilities from current assets. Let’s look at what exactly goes into each component.
Short-term assets – customer debts that should be received soon and inventory that is planned to be sold shortly. Other examples include marketable securities, prepaid expenses and, of course, cash.
Short-term liabilities — outstanding expenses and short-term loans, such as wages, unearned revenue, sales taxes payable and cash dividends payable.
In some instances, investors want to consider only short-term assets and liabilities that relate to a company’s operations and exclude any current accounts that have to do with a company’s financing activities, such as short term debts.
The working capital ratio calculation will result in a dollar amount, such as $50,000, so it is not going to provide you with a ratio in a literal sense. If the management needs to see an actual ratio, it would use a current ratio, which is current assets divided by current liabilities and it will give you a ratio like 3:2.
Example and Meaning
Let’s look at an example Balance Sheet of Alphabet Inc. for two years and see how its working capital ratio changed.
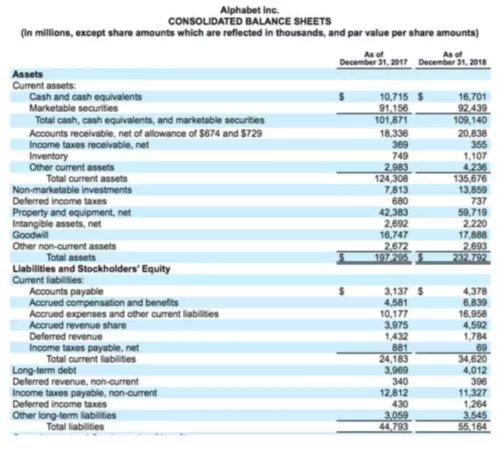
If we calculate the working capital ratio for the year of 2017, we will have $124,308 — $24,183 = $100,125. For the year of 2018, this number will equal to $135,676 — $34,620 or $101,056. Ideally, the assets should exceed liabilities so this number would be positive, which is what we see for this company. If the working capital ratio is negative, it means a bad situation for the company.
Now, let’s find the current ratio for Alphabet Inc. In 2017, we will have $124,308/$24,183 = 5.14. The result will be different for the year 2018 – 3.92. As you can see, the company is in a good position to pay off its short-term liabilities, but in 2017 it was in a better position.
A result of 1 would mean the company has the exact amount of short-term assets to pay short-term obligations. A higher number is better but too high (like 30) would mean the company is too liquid and management is not putting its assets to a good use. Some companies generate a lot of cash and just let it sit there and accumulate instead of actually making more money for the company.
It should also be noted how much inventory makes up the current assets. Why? If there are issues at the company itself or the economy as a whole (for example depression), this item might not be as liquid as the company wished it would be. In this case, it might make sense not to include that number in the calculation.