Overview
When we talk about the production of any product, we always say that the interaction of different elements and processes allows the raw material to become the final product, which is destined to get into the hands of the final consumer. Production costs are costs associated with the production of these final products. These can include material costs, labor costs, costs associated with promoting a product to the market and selling it, along with other costs.
In business, you will also come across marginal costs. Let us give a definition of marginal costs. First, let’s point out that margin is one of the important parts of basic economics. Economists will tell you that marginal means one more. So, instead of saying marginal cost, you can also say the cost of one more (or one less).
Marginal costs by definition are additional business costs for each additional increment or next unit of production in excess of the current volume, i.e. marginal cost reflects the variations in costs that are a result of an increase or decrease in production by one unit.

Calculation
The marginal cost formula is very simple as you can see below.
MC = (TC2 – TC1) / (Q2 – Q1) = ΔTC / ΔQ
Based on the marginal cost formula, we can say that these costs can also be viewed as the ratio of the increase in total costs for the reporting period to the number of manufactured products, by which the output increased during this reporting period. Mathematically, this means that the total cost invested to obtain a certain number of units must be divided by the quantity of actual units produced so that it can be defined as a unit cost. The calculation process can be done in several steps:
- Find the change in costThe costs a business incurs typically vary with a reduction or increase in the number of goods it makes or services it provides. Obviously, you will have a larger change in cost with more services provided or goods produced and vice versa. This change in costs occurs due to a change in variable costs. Obviously, even the fixed costs can increase or decrease if the business crosses a specific threshold, e.g. production facility would need to be expanded if the company decided to manufacture more than 200,000 units. Thus, your first step is to simply take the total costs a business has now and subtract from it total costs it expects to have or incurred) after it changes the level of its activity.
- Calculate the change in quantityYour next step would be to determine whether the business is adjusting its production or provision of services and by how much. Just like you did the calculation in the previous step, you would take the quantity before the change (the old quantity) and subtract that from the quantity after the change (the new quantity).
- Divide the resultsNow that you got your numbers ready for the last step, all you have to do is divide the number you got in the first step, or your change in cost, by the number you got in the second step, or your change in quantity. Keep in mind that the marginal cost per unit you calculated for the additional 50 units will most likely differ from the marginal cost per unit you would get for the additional 51 units. Accordingly, it would need to be recalculated for all the possible output options. To make this process more time-efficient, you can consider online calculators created specifically for this.
Purpose and analysis
Why would management want or need to calculate the marginal cost in the first place? When thinking of margin, economists are thinking about the cost or benefit of making a decision, e.g. buying another piece of production equipment or making another batch of goods.
As the quantity goes up, the marginal costs grow while the marginal benefit decreases. Simply put, the making of another piece brings additional costs and additional profits. As long as the marginal cost is below the market price level, the production is profitable. When it starts to exceed the price, it is an indicator of reduced efficiency.
The marginal cost analysis is very useful in project implementation because, from a financial point of view, the optimal point is between the production cost and selling price, so that an appropriate price is calculated at which the company does not lose money and at the same time does not mistreat the customer. Undoubtedly, taking this into account when planning projects will help to get the best financial result.
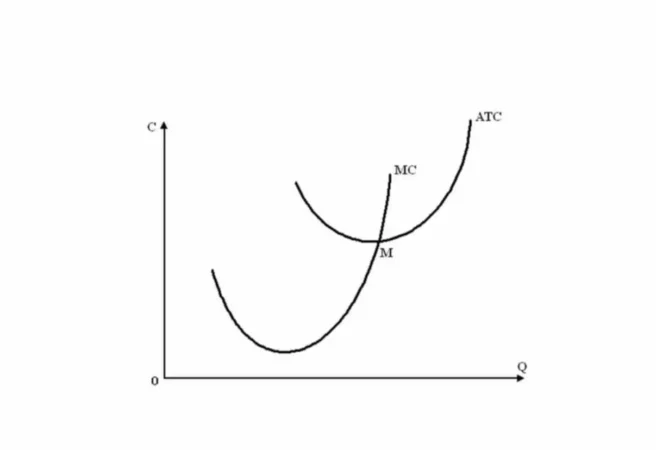
The curve representing marginal cost above depends only on the variable costs, while the effect of fixed costs is included along with the variable figures in the average cost. The marginal curve does not take into account fixed costs because they exist regardless of whether a business has more output or not.
Initially, marginal costs are reduced and stay lower than the average. This is because if unit costs decrease, then each subsequent product is cheaper than the one made before it. The subsequent growth of marginal cost means that each following unit of production becomes more expensive. The marginal costs line crosses the average costs line at its minimum point M.
Comparison and evaluation of various production costs is important information for the management of a company that is trying to determine the optimal level of business activity. At point M, the offer price coincides with the average and marginal costs. This point represents the equilibrium. When moving from point M to the right, an increase in production leads to a decrease in profit because, for each unit of goods, additional costs grow. Going beyond point M leads to instability of the company’s finances.
It is possible to directly and immediately control the marginal cost as opposed to any other costs a business might have. In fact, this is what it costs the company to have the last item made for ready for the customer, and at the same time the costs that can be cut down by reducing the volume of production by this last unit. The figures of average cost do not provide this information.
Output decisions are usually based on margins, that is, decisions about whether a business produces one unit more or one less. In combination with the marginal benefit indicator (reflects the change in income with an increase or decrease in production per unit of product), the marginal cost indicator allows management to determine the profitability of a particular change in the scale of production.
Example
Let us illustrate the marginal cost formula with an example. The total costs North Inc. incurred in June 2020 amounted to $62,500. The number of manufactured goods is 1,400 units. In July, additional 184 units were produced. Total costs for July 2020 amounted to $66,500. In other words, the total costs increased by $4,000
To calculate the marginal costs for North Inc., we will input the numbers we are given into the marginal cost formula presented earlier.
MC = ($66,500 – 62,500) / (1,584 – 1,400)
MC = $4,000/184
MC = $21.74
Based on the calculations we just did, we can say that each extra unit the company made in July cost North Inc. $21.74. It was a reasonable decision to produce more goods because the average cost per unit in June was $44.64, so the company is at a point where the benefits of making more goods significantly overweight the associated costs. Moreover, after further analysis, it might be likely that North Inc. should consider increasing its production even more to rip maximum benefits and make more profit.